Last updated: October 21, 2026.
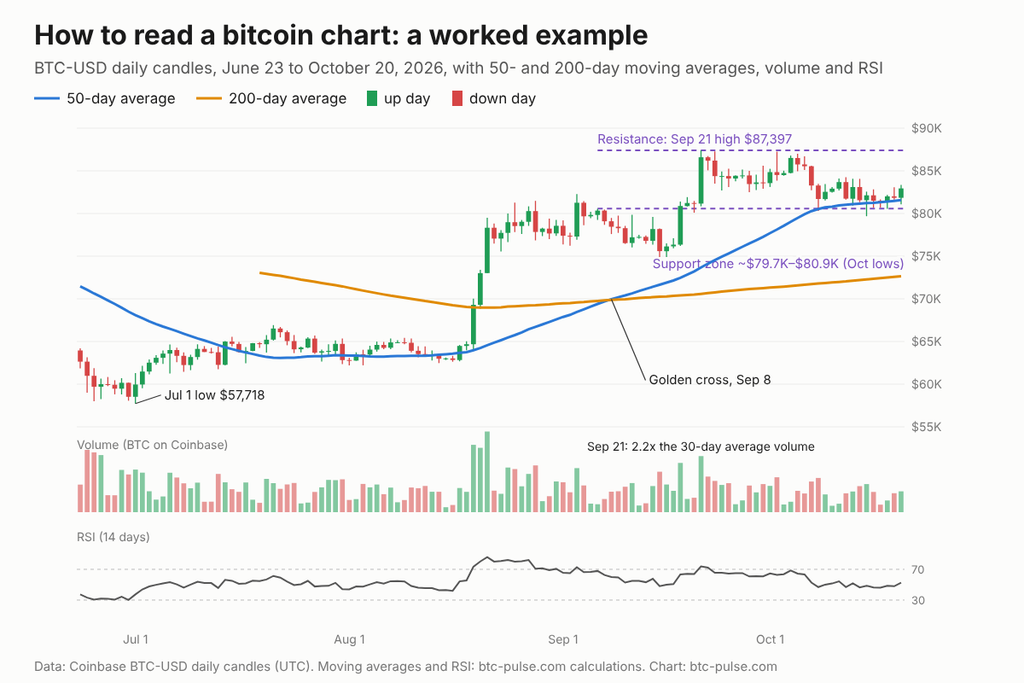
Short answer: To read a crypto chart, start with the timeframe, then read each candle (open, high, low, close), check volume, and compare the price with its 50-day and 200-day moving averages. Then mark the levels where the price keeps stopping (support and resistance) and check RSI for momentum. On October 18, 2026, bitcoin closed at $82,006.85, just above its 50-day average of $81,395.93 and 13.1% above its 200-day average of $72,493.98. Below, we read one real bitcoin chart step by step.
Key takeaways
- One candle = one period. On a daily chart, each candle shows the open, high, low and close for one UTC day (8 p.m. to 8 p.m. Eastern time in October).
- Volume tells you how much conviction is behind a move. Bitcoin’s August 19 to August 21, 2026 rally of 21.1% came on 2.8 to 3.4 times the usual volume on Coinbase.
- Moving averages show the trend, but late. The 50-day average crossed above the 200-day on September 8, 2026 (a “golden cross”), 20 days after the rally started and $13,766 higher.
- Support and resistance are zones, not exact lines. In October 2026, bitcoin dipped into the $79,676.02 to $80,927.48 zone on four days and closed at $81,692.79 or higher each of those days.
- RSI above 70 isn’t a sell signal by itself. Bitcoin’s RSI first topped 70 on August 19, 2026, at a close of $69,300.01. On October 18, 2026, the price was still 18.3% higher.
The six things to check on any crypto chart
| What to check | What it tells you | What our bitcoin chart showed (to October 18, 2026) |
|---|---|---|
| Timeframe | How much detail and noise you see | Daily candles, June 21 to October 18, 2026 |
| Candles | Who won each period: buyers (green) or sellers (red) | September 21, 2026: +6.7% in one day, from $81,160.33 to $86,594.94 |
| Volume | How strong a move is | August 19 to August 21, 2026: 2.8x to 3.4x the 30-day average |
| Moving averages | The trend and where it may change | Price 0.8% above the 50-day, 13.1% above the 200-day; golden cross September 8, 2026 |
| Support and resistance | Where buyers and sellers keep stepping in | Support about $79,700 to $80,900; resistance at the September 21, 2026 high of $87,397 |
| RSI (14 days) | Momentum, from 0 to 100 | 48.7: neutral. Peak 86.0 on August 21, 2026; low 30.2 on June 30, 2026 |
Scroll the table horizontally to see all columns.
Data: Coinbase BTC-USD daily candles (UTC), through October 18, 2026. Averages, RSI and volume ratios: btc-pulse.com calculations.
Step 1: Pick the timeframe
Choose the timeframe before you look at anything else, because the same market can look like it’s rising (bullish) on one and falling (bearish) on another. A daily chart is the best place to start. Each candle covers one day, so you see the trend without the noise of every hour.
- 1-hour or 4-hour candles: for day traders. Most of the moves are noise.
- Daily candles: for most investors. This is what we use below.
- Weekly candles: for the big trend. One weekly candle covers seven days of trading.
Crypto trades 24 hours a day, 7 days a week, so there’s no market close like on the stock market. Coinbase and most exchanges start each daily candle at 00:00 UTC, which is 8 p.m. Eastern time while daylight saving time is in effect.
Step 2: Read the candles
A candlestick shows four prices: open, high, low and close. The thick part (the body) runs from the open to the close. The thin lines (the wicks) show how far the price went above and below during the period.
- Green candle: the close was higher than the open.
- Red candle: the close was lower than the open.
- Long upper wick: buyers pushed the price up, but sellers pushed it back down before the close.
- Long lower wick: sellers pushed it down, but buyers stepped in.
Worked example: September 21, 2026. Bitcoin opened at $81,160.33, hit a high of $87,397.00, dipped to a low of $80,837.42 and closed at $86,594.94. That’s a green body of $5,434.61 (+6.7%), with a short upper wick of $802.06. Buyers held almost the whole move into the close. On a $1,000 position, that one day added about $67.
Step 3: Check the volume
Volume shows how much was traded, and a move on high volume is more meaningful than one on low volume. Compare each day with the recent average, not with a fixed number.
On our chart, the August 19 to August 21, 2026 rally took bitcoin from $64,681.33 to $78,325.54, or 21.1% in three days. Volume on Coinbase was 3.1x, 2.8x and 3.4x the 30-day average on those days. That made the move harder to dismiss as thin trading. The price never closed back below $75,000 after that. The September 21, 2026 jump of 6.7% came on 2.2x the average volume, too.
Weekends are quieter. Over the eight weeks to October 18, 2026, Coinbase traded an average of 2,488 BTC on Saturdays and Sundays, compared with 7,375 BTC on weekdays. A big move on a quiet weekend deserves less trust.
Watch out: the volume on a chart is usually from one exchange only. Our chart uses Coinbase, so the absolute numbers are smaller than the volume across all exchanges. Use it to compare days with each other, not as the market total.
Step 4: Add moving averages
A moving average smooths the price into one line, so you can see the trend. The 50-day simple moving average is the average close of the last 50 days. The 200-day is the same over 200 days. Traders watch both.
On October 18, 2026:
- Price: $82,006.85
- 50-day average: $81,395.93 (price 0.8% above it)
- 200-day average: $72,493.98 (price 13.1% above it), up from $70,398.02 thirty days earlier
When the 50-day crosses above the 200-day, traders call it a golden cross; the opposite is a death cross. On our chart, the golden cross came on September 8, 2026, with both averages near $69,900. By then bitcoin had already closed at $78,447.11, up from $64,681.33 on August 18, 2026, before the rally began. That’s the main limit of moving averages: they confirm a trend after much of the move has happened.
For the longer view, see our guide to the bitcoin 200-week moving average.
Step 5: Mark support and resistance
Support is a price zone where buying keeps stopping the fall; resistance is a zone where selling keeps stopping the rise. Find them by looking for places where several candles stopped at about the same price.
- Support: in October 2026, bitcoin’s daily lows hit $80,314.70 (October 8, 2026), $80,927.48 (October 13, 2026), $79,676.02 (October 15, 2026) and $80,564.57 (October 18, 2026). Each time it closed higher, at $81,692.79 or above.
- Resistance: the September 21, 2026 high of $87,397.00. On October 2, 2026, bitcoin reached $87,249.05, within 0.2% of that level, and closed lower at $84,504.88.
That’s a range about 9.7% wide, from $79,676.02 to $87,397.00. Traders often watch for a daily close outside a range like this. Draw these levels as zones, not exact lines: on October 15, 2026, the price dipped below $80,000 during the day and still closed at $82,131.46.
Step 6: Check RSI
RSI (Relative Strength Index) measures how fast the price has moved, on a scale from 0 to 100. It compares average gains with average losses over the last 14 periods. Above 70 is called “overbought”, below 30 “oversold”.
On our chart, RSI hit 30.2 on June 30, 2026, a day before the chart’s lowest price, an intraday low of $57,717.55 on July 1, 2026. It then climbed to 86.0 on August 21, 2026, and stayed above 70 on 12 of the 13 days from August 19, 2026 to August 31, 2026. A trader who sold just because RSI was “overbought” on August 19, 2026 at $69,300.01 would have missed the move to $78,325.54 two days later. On October 18, 2026, RSI was 48.7, right in the neutral middle.
Watch out: in a strong trend, RSI can stay above 70 or below 30 for weeks. Treat it as a measure of speed, not a signal on its own.
Linear or log scale?
Use a log scale when you look at years of crypto prices. On a log scale, the same percentage move takes up the same height: a rise from $10,000 to $20,000 looks as big as one from $50,000 to $100,000. On a linear scale, the older moves shrink to a flat line. For a few months of data, like our chart, a linear scale is fine. Our bitcoin rainbow chart guide explains how a log chart works across bitcoin’s whole history.
Common mistakes
- Reading one indicator alone. A golden cross, an RSI reading or a single candle means little by itself. Look for three or four signals that agree.
- Ignoring the timeframe. A “breakdown” on a 15-minute chart is often noise on a daily chart.
- Treating levels as exact. Support at “$80,500” is a zone. Prices often poke through for a few hours.
- Forgetting where the volume comes from. Single-exchange volume is useful for comparisons, not as the market total.
- Chasing leverage based on a chart. If you trade futures, funding costs (fees between long and short traders) and liquidation levels (where the exchange closes your position) matter as much as the pattern. See our guide to crypto funding rates.
What this means for you
- If you hold bitcoin for the long term, check the daily or weekly chart against the 200-day average once in a while. Bitcoin was 13.1% above it on October 18, 2026.
- If you’re thinking about buying, charts show where the price is in its range, not where it’s going. Pair the chart with other data, like the five indicators in Is now a good time to buy bitcoin?.
- If you trade, decide in advance which levels would change your view. On our chart, those were the edges of the October 2026 range, about $79,700 and $87,397.
Quick checklist
- Set the chart to daily candles and a log scale for anything longer than a year.
- Read the last few candles and compare their volume with the 30-day average.
- Add the 50-day and 200-day averages and note where the price sits.
- Mark support and resistance zones where the price stopped more than once.
- Check RSI last, and only as a measure of speed.
FAQ
How do you read a crypto candlestick chart? Each candle shows the open, high, low and close for one period. A green body means the close was above the open, a red body means it was below, and the wicks show the highest and lowest prices.
What is the best timeframe for crypto charts? For most investors, daily candles. They show the trend without the noise of hourly charts. Use weekly candles for the long-term trend.
What do the green and red bars at the bottom of a chart mean? They show trading volume for each period, colored to match the candle above. Taller bars mean more coins were traded.
What is a golden cross in crypto? It’s when the 50-day moving average crosses above the 200-day. Bitcoin’s last one came on September 8, 2026. It confirms an uptrend, but usually after a large part of the move.
What does RSI above 70 mean? The price has risen fast over the last 14 periods. It’s often called “overbought”, but in strong trends RSI can stay above 70 for weeks, as bitcoin’s did in August 2026.
Where can I see crypto charts for free? Most exchanges, including Coinbase, show free candlestick charts with volume, moving averages and RSI. Free charting websites offer the same tools.
What is the best indicator for crypto charts? None works alone. Moving averages show the trend, volume shows conviction and RSI shows speed. Use them together.
Can charts predict the price of bitcoin? No. Charts show what buyers and sellers have done and where they reacted before. They help you plan levels and manage risk, but they don’t tell you what happens next.
Sources
- Coinbase Exchange API: BTC-USD candles (API endpoint; daily candles through October 18, 2026)
- Coinbase Developer Documentation: Get product candles (candle format and daily granularity)
- StockCharts ChartSchool: Relative Strength Index (RSI) (RSI formula and 70/30 levels)
- StockCharts ChartSchool: Moving Averages (simple moving averages and crossovers)
This article is for informational purposes only and is not investment advice.