
Last updated: October 12, 2026.
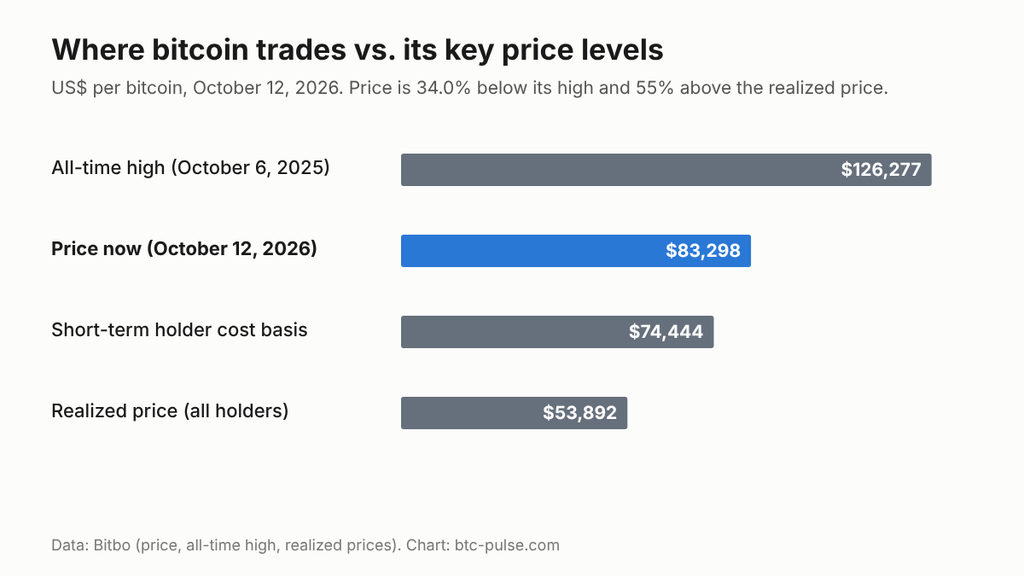
Bitcoin traded at $83,298 on October 12, 2026, 34.0% below its record of $126,277, according to Bitbo. Five widely watched indicators give a mixed picture, and none of them can say where the price goes next.
Short answer: As of October 12, 2026, valuation looks moderate: the MVRV ratio is 1.55, well below this cycle’s peak of about 2.5 (January 2025). Sentiment reads “Greed” (69), and US spot Bitcoin ETFs have had net outflows of $386.3 million in October so far. The data show where the market stands; the decision, and how much risk to take, stays with the reader.
Figures checked against Bitbo, alternative.me and Farside Investors as of October 12, 2026.
What changed: outflows of $729.0 million from spot Bitcoin ETFs on October 7 and October 8, 2026, erased the $321.6 million of net inflows from the first four trading days of the month, according to Farside Investors.
Key takeaways
- Price: $83,298, down 34.0% from the $126,277 high of October 6, 2025, and 44% above this cycle’s low so far (about $57,950 on July 1, 2026). Past bear markets fell 77% to 87%.
- Valuation (MVRV 1.55): the price is 55% above the average price at which all coins last moved. Each cycle peak came at a lower MVRV: above 4 in 2017, about 3.8 in 2021, about 2.5 in the 2025 cycle.
- Recent buyers: the price is 11.9% above the average cost of coins that moved in the last 155 days ($74,444).
- Sentiment and flows: Fear & Greed at 69 (“Greed”); ETF flows were −$386.3 million for October through October 9, 2026.
The five indicators at a glance
Most indicators sit away from the extremes that marked past tops or bottoms.
| Indicator | Now | What it measures | Historical context |
|---|---|---|---|
| Drop from all-time high | −34.0% | How far the price is below its record | This cycle so far: −54% (July 1, 2026). Past bear-market lows: −87% (2015), −84% (2018), −77% (2022) |
| MVRV ratio | 1.55 | Market value vs. the price at which coins last moved | Peaks: above 4 (2017), about 3.8 (2021), about 2.5 (2025 cycle). Below 1 only near the deepest bottoms |
| Short-term holder cost basis | $74,444 (price 11.9% above) | Average cost of coins that moved in the last 155 days | Price below it means recent buyers are at a loss on average |
| Fear & Greed Index | 69, “Greed” | Market mood on a 0 to 100 scale | 0 = extreme fear, 100 = extreme greed |
| Spot ETF flows | −$386.3M in October 2026 so far | Money into or out of US spot Bitcoin ETFs | +$2.65B in September 2026 |
Scroll the table horizontally to see all columns.
Data as of October 12, 2026. Price, all-time high, MVRV and realized prices: Bitbo. Fear & Greed: alternative.me. ETF flows: Farside Investors, through October 9, 2026. Historical drawdowns and MVRV: BIT Knowledge Hub, K33 Research. 2026 low: BloFin Research.
1. How far is bitcoin below its all-time high?
Bitcoin was 34.0% below its record on October 12, 2026, according to Bitbo. It reached $126,277 on October 6, 2025, and traded at $83,298 on October 12, 2026.
The low of this cycle so far came on July 1, 2026, at about $57,950, 54% below the high, according to BloFin Research. Since then the price has recovered about 44%. In earlier cycles, according to BIT’s cycle data, bitcoin fell 87% from its 2013 peak, 84% from its 2017 peak ($19,665 to $3,122) and 77% from its 2021 peak ($69,044 to $15,479). Each of those declines took roughly a year.
How to read it: today’s price sits between this cycle’s high and its July 2026 low. The data can’t say whether that low will hold; nothing requires the next bottom to look like the last three.
2. What does the MVRV ratio say?
MVRV stood at 1.55 on October 12, 2026, according to Bitbo. MVRV divides bitcoin’s market value by its realized value, the sum of every coin priced at the moment it last moved on the blockchain. Realized value works as a rough cost basis for the whole network; per coin, that “realized price” is $53,892.
An MVRV of 1.55 means the market price is 55% above that average cost. MVRV peaked at 4.72 in December 2017 (K33 Research) and at about 3.8 at both 2021 tops (BIT; K33 puts the spring 2021 peak at 3.96). In the 2025 cycle it peaked at only about 2.5, in January 2025, before the price top (Amberdata, cited by BIT). It has dropped below 1 only near the bottoms of the worst bear markets; in 2018 bitcoin traded below its realized value for about four months.
How to read it: at 1.55, MVRV is well below this cycle’s January 2025 peak of about 2.5 and above the “below 1” zone that marked the deepest lows. Each peak has come lower than the one before, so old thresholds may not apply.
3. Are recent buyers in profit?
Yes, on average. The short-term holder realized price, the average cost of coins that moved in the last 155 days, was $74,444 on October 12, 2026, according to Bitbo. Glassnode, a blockchain data firm, uses 155 days as the line between short-term and long-term holders.
The price is 11.9% above that level, so the average recent buyer is in profit. Analysts watch this level because recent buyers have historically been the most price-sensitive sellers.
How to read it: $74,444 is the line between recent buyers being in profit or at a loss on average. A fall below it would put the average recent buyer under water.
4. What does the Fear & Greed Index show?
The index read 69, “Greed”, on October 12, 2026, according to alternative.me. Over the previous 30 days it ranged from 50 (September 17, 2026, the day after the Fed’s rate hike) to 78, “Extreme Greed” (September 22, 2026).
The index from alternative.me combines volatility (25%), momentum and volume (25%), social media (15%), bitcoin’s share of the crypto market (10%) and Google search trends (10%); a survey component (15%) is paused. Zero means extreme fear and 100 means extreme greed.
How to read it: the index is a mood gauge, not a price signal. Extremes have often coincided with sharp moves in both directions. At 69, it is in neither extreme zone.
5. Are ETF investors buying or selling?
They are selling in October so far. US spot Bitcoin ETFs had net outflows of $386.3 million from October 1 to October 9, 2026, according to Farside Investors, after inflows of $2.65 billion in September 2026. On October 7 and October 8, 2026, a combined $729.0 million left the funds; the October 7 outflow of $484.9 million was larger than September’s worst day (−$450 million on September 15, 2026).
The month started with a third straight week of inflows, and two days reversed it. On October 9, 2026, flows turned slightly positive at +$21.1 million. Our daily October flow data by fund shows which funds drove the outflows. Our spot Bitcoin ETF tracker shows which funds hold the most bitcoin and is updated every Friday.
How to read it: ETF flows show what investors are doing right now. In September 2026 the biggest swings lined up with the Fed decision: −$450 million the day before the hike, then inflows for nine trading days after it.
What these indicators can’t tell you
- The future. Each indicator describes the market today. None predicts the price next month.
- Macro shocks. Interest-rate decisions can move the market quickly. The Fed raised rates on September 16, 2026, and the next decision is due on October 28, 2026.
- Your situation. Whether to buy depends on your timeline, your other savings and how much of a loss you can live with. Bitcoin fell more than 75% in each of its last three bear markets.
Before buying bitcoin now: a common checklist
Personal-finance guides commonly list these conditions before buying a volatile asset:
- An emergency fund of 3 to 6 months of expenses is already in place.
- No high-interest debt, such as credit card balances.
- A time horizon of years, not months. Each of the last three bear markets lasted about a year.
- An amount you could watch fall 80% without needing to sell.
The indicators above say nothing about whether these conditions are met.
If you decide to buy: two common approaches
- Dollar-cost averaging (DCA): buying a fixed dollar amount on a schedule, for example $100 every week. You get an average price over time instead of betting on one day.
- Lump sum: buying all at once. You are fully invested sooner, but the result depends on a single entry price.
In both cases, the result depends heavily on position size: bitcoin fell 77% to 87% from its peak in each of the last three bear markets.
What to watch next
- October 14, 2026, 8:30 a.m. ET: September CPI (Consumer Price Index, the main US inflation gauge), per the Bureau of Labor Statistics. A hot reading could raise the odds of another rate hike.
- October 16, 2026: weekly update of ETF flows and fund holdings in our spot Bitcoin ETF tracker.
- October 28, 2026: Fed rate decision, per the Fed’s meeting calendar.
FAQ
Is now a good time to buy bitcoin? No one can know in advance. As of October 12, 2026, bitcoin is 34.0% below its high and its MVRV ratio is far from past tops, but sentiment reads “Greed” and ETF flows are negative in October so far. The data describe the risk; the decision depends on each investor’s goals.
What is the best time to buy bitcoin? There is no reliable best day or month. Bitcoin trades around the clock, while spot Bitcoin ETFs trade only during US market hours. Many investors avoid the timing question by buying a fixed amount on a schedule (dollar-cost averaging).
Should I buy bitcoin now or wait for a dip? Waiting can work if the price falls, but it can also mean buying higher later. Some investors split a purchase over several weeks as a middle ground.
What is a good MVRV ratio to buy bitcoin? Historically, MVRV near or below 1 has lined up with major bottoms. Peaks have come lower each cycle: above 4 in 2017, about 3.8 in 2021, about 2.5 in the 2025 cycle. It was 1.55 on October 12, 2026. Past patterns may not repeat.
How low can bitcoin go? In the last three bear markets bitcoin fell 77% to 87% from its peak. In this cycle it fell 54% by July 1, 2026, and was 34.0% below its October 2025 high on October 12, 2026. There is no guarantee the next decline will be smaller or larger.
Sources
- Bitbo: price, all-time high, MVRV, realized price and short-term holder realized price, October 12, 2026
- Alternative.me: Crypto Fear & Greed Index: current value, method and 30-day history
- Farside Investors: Bitcoin ETF Flow: daily ETF flows
- K33 Research: Using MVRV to estimate market tops and bottoms: historical MVRV levels
- Glassnode: Short-Term Holder Realized Price: definition and the 155-day threshold
- BIT Knowledge Hub: Bitcoin cycles and MVRV explained: past drawdowns and MVRV peaks
- BloFin Research: 2026 low
This article is for informational purposes only and is not investment advice.