
Last updated: October 9, 2026. Flows through October 8, 2026. This page is updated every Friday; the full-month report goes up here on November 2, 2026.
October 2026 so far
| Metric | Value |
|---|---|
| Net flows, all US spot Bitcoin ETFs | −$407.4 million |
| Trading days counted | 6 (3 inflow days, 3 outflow days) |
| Biggest day | +$189.9 million on October 2, 2026 |
| Worst day | −$484.9 million on October 7, 2026 |
| Top fund | BlackRock IBIT, +$332.5 million |
| Biggest outflow | Fidelity FBTC, −$408.1 million |
| Start of September 2026 | +$770 million (first four trading days, September 1 to September 4, 2026) |
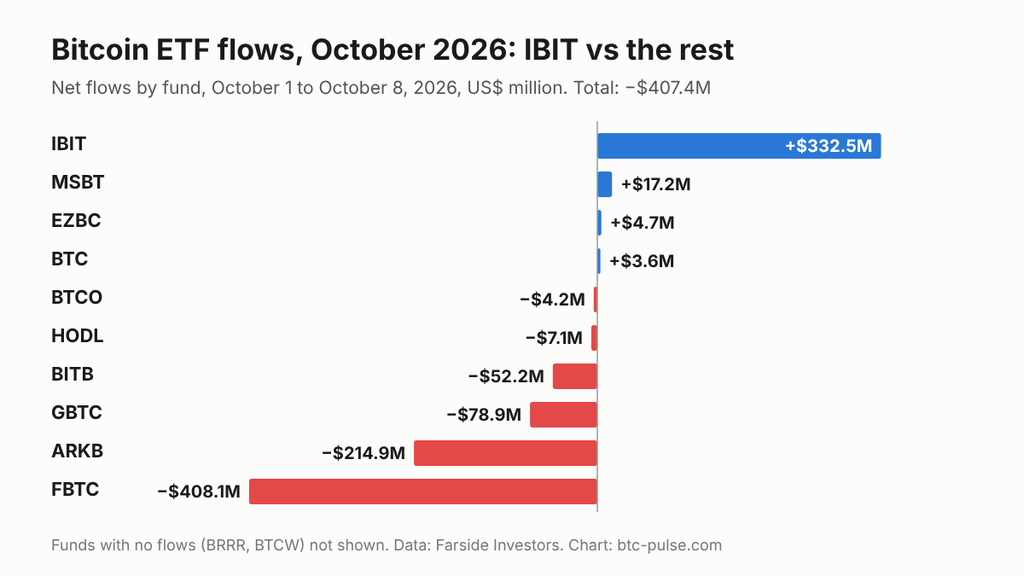
Short answer: US spot Bitcoin ETFs lost $407.4 million from October 1 to October 8, 2026. The month was up $321.6 million until October 6. Then two days of selling took out $729.0 million: −$484.9 million on October 7 and −$244.1 million on October 8, 2026. BlackRock’s IBIT is still up $332.5 million; the other eleven funds are down $739.9 million combined.
Key takeaways
- Two bad days flipped the month. October 7 and October 8, 2026 erased the first week’s gains and more. Only one fund, Franklin’s EZBC, had an inflow on either day ($4.7 million).
- Fidelity is now the biggest loser: FBTC is down $408.1 million, almost half of it ($197.1 million) on October 8, 2026 alone.
- IBIT still leads. It took $545.7 million of the $611.5 million in gross inflows this month (89%; gross inflows are the sum of every positive daily fund flow).
- This week is worse than the week before the Fed hike. October 5 to October 8, 2026 lost $700.0 million, against −$463 million on September 8 to September 11, 2026.
Daily flows
| Day | Net flows | Biggest move |
|---|---|---|
| Thursday, October 1, 2026 | +$102.7M | IBIT +$195.6M, FBTC −$60.7M |
| Friday, October 2, 2026 | +$189.9M | IBIT +$158.2M |
| Monday, October 5, 2026 | −$89.8M | ARKB −$85.2M, FBTC −$74.5M |
| Tuesday, October 6, 2026 | +$118.8M | IBIT +$122.0M |
| Wednesday, October 7, 2026 | −$484.9M | IBIT −$207.7M, FBTC −$105.1M, ARKB −$101.7M |
| Thursday, October 8, 2026 | −$244.1M | FBTC −$197.1M |
| Month to date | −$407.4M |
Flows through October 8, 2026. Data: Farside Investors, as of October 9, 2026.
Fund by fund
| Fund | Issuer | Fee | October net flow |
|---|---|---|---|
| IBIT | BlackRock | 0.25% | +$332.5M |
| MSBT | Morgan Stanley | 0.14% | +$17.2M |
| EZBC | Franklin Templeton | 0.19% | +$4.7M |
| BTC | Grayscale (Mini) | 0.15% | +$3.6M |
| BRRR | CoinShares | 0.25% | $0.0M |
| BTCW | WisdomTree | 0.25% | $0.0M |
| BTCO | Invesco Galaxy | 0.25% | −$4.2M |
| HODL | VanEck | 0.20% | −$7.1M |
| BITB | Bitwise | 0.20% | −$52.2M |
| GBTC | Grayscale | 1.50% | −$78.9M |
| ARKB | ARK 21Shares | 0.21% | −$214.9M |
| FBTC | Fidelity | 0.25% | −$408.1M |
| Total | −$407.4M |
Data: Farside Investors, October 1 to October 8, 2026. Fees: Farside Investors.
What the numbers say
October 7, 2026 was worse than any day in September 2026. The $484.9 million that left the funds beat September’s worst day (−$450 million on September 15, 2026). Six funds had outflows and none had inflows. The same day the Fed published the minutes of its September meeting. Flow data alone can’t show whether the two are linked.
October 8, 2026 kept the selling going, mostly at Fidelity. FBTC lost $197.1 million, 81% of the day’s total. IBIT lost only $5.5 million. Franklin’s EZBC was the one fund with an inflow, $4.7 million.
IBIT keeps taking a bigger share. It’s up $332.5 million for the month while the other eleven funds are down $739.9 million. In September 2026, IBIT took 68% of net inflows ($1.81 billion). It holds 62% of all bitcoin in US spot ETFs (805,222 of 1,293,818 BTC as of October 5, 2026, per our spot Bitcoin ETF tracker).
Fees don’t explain the Fidelity and ARK outflows. FBTC and ARKB each had outflows on four of six days. They charge about the same as IBIT: a $10,000 position costs $25 a year in FBTC or IBIT (0.25%) and $21 in ARKB (0.21%). In September 2026, FBTC still took in $682 million.
MSBT, the cheapest fund at 0.14% a year, added $17.2 million, with inflows on three of six days and no outflows.
The late-September momentum is gone. The week of September 21 to September 25, 2026 brought in $2.39 billion, the largest weekly inflow since October 2025. The week of September 28 to October 2, 2026 added $241.1 million, a third straight week of inflows. The week of October 5 to October 8, 2026 is at −$700.0 million. Our September 2026 report shows how flows turned after the Fed’s rate hike on September 16, 2026.
What this means for you
- If you hold a spot Bitcoin ETF, outflows don’t change what your shares hold: each share still tracks bitcoin’s price minus the fee. Outflows show what other investors are doing, not what your fund is worth.
- If you’re choosing a fund, size and fees matter more than one month of flows. IBIT is the largest; MSBT is the cheapest at 0.14%.
- If you follow flows, watch the macro dates below. In September 2026 the biggest swings came around the Fed decision.
2026 so far
| Period | Net flows |
|---|---|
| January to September 2026 | ≈ +$0.9B |
| October 1 to October 8, 2026 | −$0.41B |
| Year to date | ≈ +$0.5B |
| Since launch (January 11, 2024) | ≈ +$57.2B |
January to September 2026: monthly totals from our September 2026 report; providers can differ by tens of millions of dollars. Since-launch total: Farside Investors, through October 8, 2026.
What to watch in October
- October 14, 2026, 8:30 a.m. ET: September CPI (Consumer Price Index, the main US inflation gauge). A hot inflation print could revive bets on a second rate hike. In September 2026, ETF investors pulled money in the days before the Fed decision.
- October 27 to October 28, 2026: Fed meeting. The decision comes on October 28, 2026. After the September 16, 2026 hike, flows turned positive and stayed positive for nine trading days.
- Friday updates. We add each week’s data here every Friday and publish the final October total on November 2, 2026.
How we calculate ETF flows
Net flow is the dollar value of new fund shares created minus shares redeemed on a given day. When it’s positive, the fund took in bitcoin (bought in the market or delivered in kind); when it’s negative, bitcoin left the fund. We take daily figures from Farside Investors, which compiles them from issuer disclosures, and sum them with code. Some issuers report a day late, so a late figure can change a daily total; if that happens, we update this page and its “Last updated” date.
Key numbers to remember
- −$407.4 million: October 2026 net flows through October 8, 2026.
- −$729.0 million: lost on October 7 and October 8, 2026 combined.
- +$332.5 million: IBIT, the only fund with large inflows this month.
- −$408.1 million: FBTC, the biggest outflow this month.
FAQ
How much money went into Bitcoin ETFs in October 2026? None on net so far. Through October 8, 2026, US spot Bitcoin ETFs had net outflows of $407.4 million over six trading days. We update this number every Friday.
Which Bitcoin ETF has the most inflows in October 2026? BlackRock’s iShares Bitcoin Trust (IBIT), with $332.5 million. Morgan Stanley’s MSBT is a distant second at $17.2 million.
Which Bitcoin ETF has the biggest outflows in October 2026? Fidelity’s FBTC, with −$408.1 million, followed by ARK 21Shares’ ARKB at −$214.9 million.
Why are Bitcoin ETFs seeing outflows in October 2026? Flow data shows who sold, not why. The two worst days, October 7 and October 8, 2026, came right after the Fed’s September minutes were published and a week before September’s CPI report. Both are dates investors watch for rate signals.
When will the full October 2026 report be published? On November 2, 2026, the first business day of November, on this same page.
Sources
- Farside Investors: Bitcoin ETF Flow (daily flows, fees, all-time totals)
- Bureau of Labor Statistics: CPI release schedule
- Federal Reserve: FOMC meeting calendar
- btc-pulse: Bitcoin ETF Flows September 2026 (monthly totals for 2026)
- btc-pulse: Spot Bitcoin ETF tracker (holdings as of October 5, 2026)
This article is for informational purposes only and is not investment advice.